E-Grocery Insights BD
View on GitHub →
Python
Selenium
Pandas
Tableau
GitHub
Online grocery pricing in Bangladesh moves constantly — platforms run rotating offers, and brand presence shifts week to week. This project treats that as a market-intelligence problem: scrape live pricing data, structure it, and surface the patterns a category manager would actually want to see.
Tools & purpose
- Scraped 8,085+ live product and pricing data from online grocery platforms (Chaldal & Shwapno) using Selenium.
- Cleaned and transformed data with pandas / numpy in Jupyter Notebook.
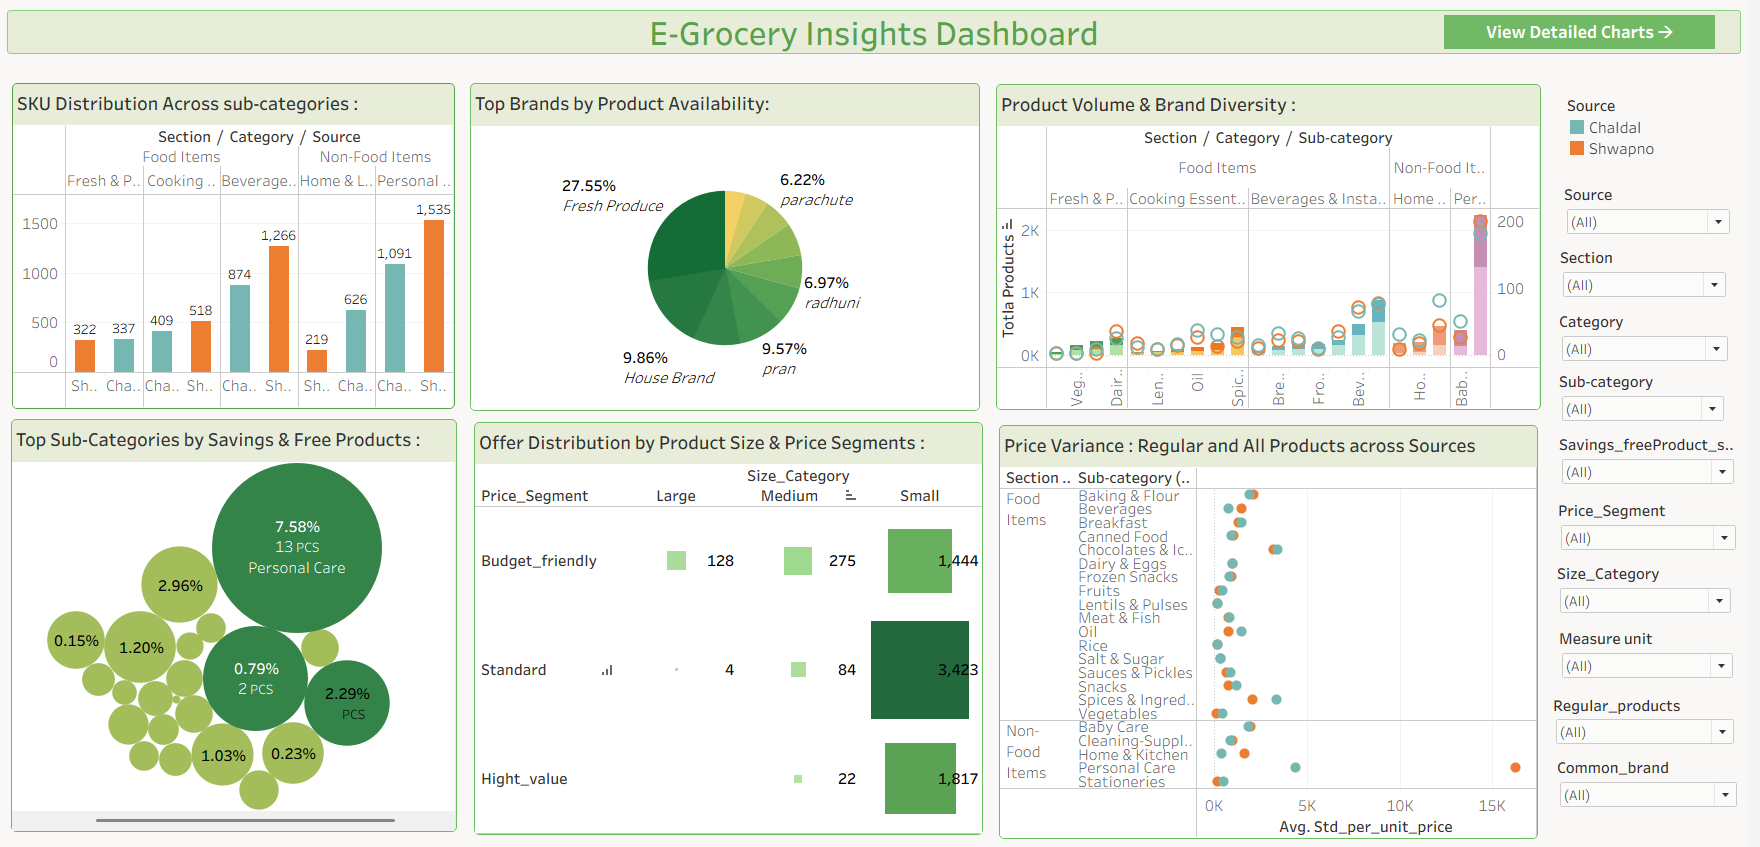
- Built an interactive Tableau dashboard visualizing pricing trends, offer & savings distribution, brand dominance, and market insights.
- Published the full project on GitHub.
Challenges in Data Processing
- Removed ~890 duplicate and null entries during data cleaning.
- ~350 multi-category products were standardized by keeping the most relevant category.
- Price and unit variations exist for the same product across platforms due to packaging differences.
- Brand extraction (~700 brands) required keyword-based parsing with manual correction.
- ~4,000 products with generic units were processed using derived fields (actual unit, savings, price metrics, etc.)
- Out-of-stock status from Chaldal could not be fully captured, which may slightly affect analysis.
What the dashboard shows
- Pricing trends across products and platforms over time.
- Offer and savings distribution — where discounts are concentrated.
- Brand dominance — which brands show up most often, and at what price tier.
- Overall market insights useful for spotting pricing patterns at a glance.